Skip to content
UPOU Networks Logo
  • Home
  • About
    • The UPOU Networks
    • Understanding OERs
    • Creative Commons
  • Learning Resources
    • Videos
      • Lectures
      • Academic Events
      • Conference E-Proceedings
      • Archive
    • Podcasts
    • Publications
      • UPOU eJournals
      • Monograph Series
      • UPOU Books
      • Coffee Table Books
    • Likha ni Isko at Iska
  • Featured
  • Submit
  1. Home
  2. Business Analytics

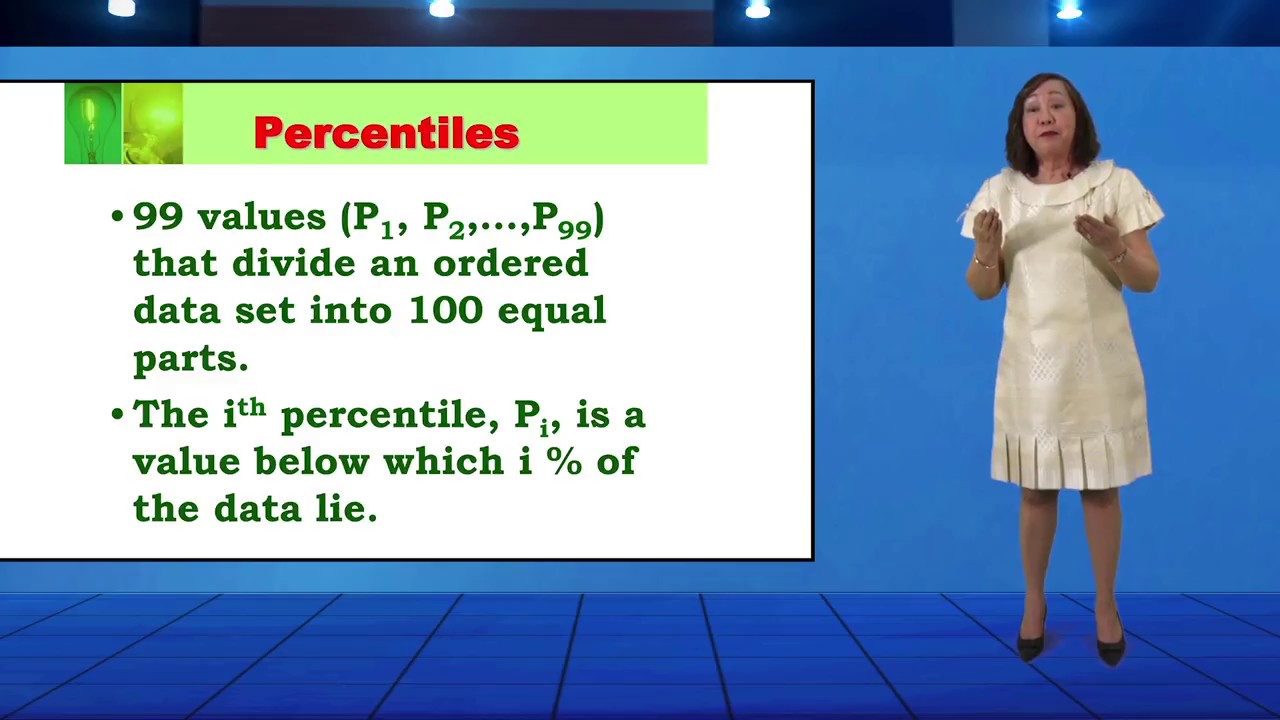
Visualization and Descriptive Statistics Shape of a Distribution | Dr. Shao Hsun Keng — Private

Published On: June 7th, 2018
For privacy reasons YouTube needs your permission to be loaded.

Tags:

Business Analytics, Descriptive Statistics, Dr. Shao Hsun Keng, eLearning, Massive Open and Online Courses, MOOCs, Shape of Distribution, Statistics, up open university, Video Post, Visualization

Related Posts

  • Business Analytics: Artificial Neural Networks | Dr. Eugene Rex Jalao
  • Business Analytics: Queuing Theory | Asst. Professor Angelo Ani
  • Business Analytics: Social Media Sentiment Analysis | Dr. Eugene Rex Jalao
  • Business Analytics: Data Reduction and Manipulation | Dr. Eugene Rex Jalao
Previous101112Next

Center for Open and Digital Teaching and Learning

All content is licensed under Creative Commons Attribution 4.0
International License, unless otherwise stated.

For inquiries, contact us at [email protected].
Toggle Sliding Bar Area
Page load link
Go to Top